We have found it necessary to illuminate the sphere through a monochrometer to determine the sensitivity at a particular wavelength. Bandpass filters used for this purpose appeared to give erroneous readings, presumably due to "red leaks" at long wavelengths. The diode detector is sensitive to the whole wavelength range from 2500Å to 1.1 µ and had to be open to any radiation in the sphere if the detector calibration was to be used directly. Our most successful and repeatable calibrations were obtained when the sphere was illuminated through a high-speed, low-resolution monochrometer. In order to work in the 2500Å to 4500Å region a xenon arc lamp was required.
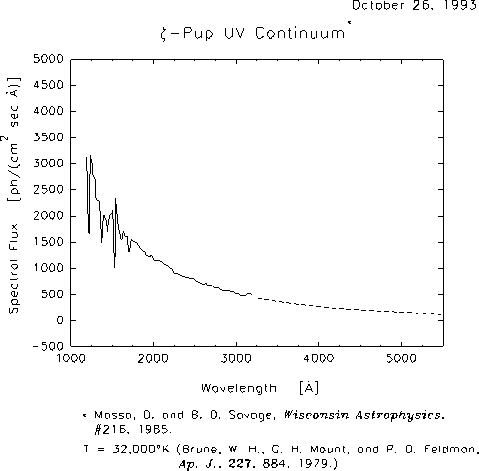
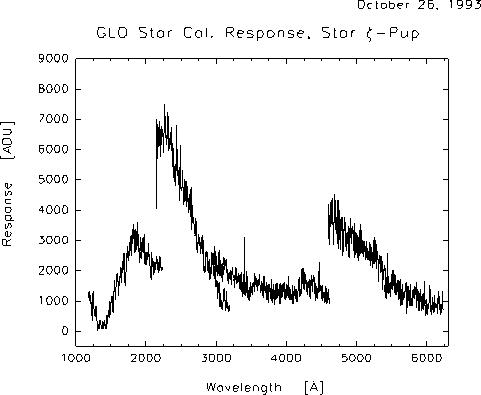
 -Pup. Figure 2 shows the spectral response of the GLO spectrographs to
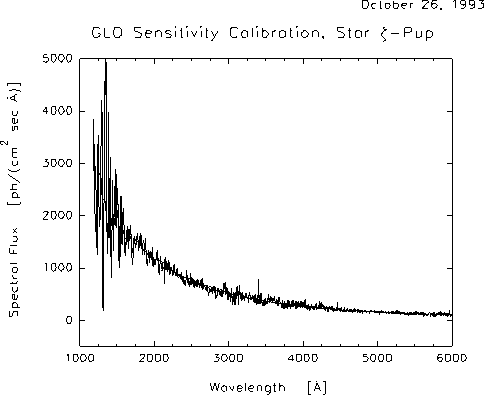
this star passing through its field of view. Figure 3 shows the spectra
in Figure 2 calibrated with sensitivity curves determined by knowing the
spectral content of the stellar source and the sensitivity of the GLO
instrument at 5000Å, where the stellar spectrum was normalized.
This star spectrum was very important because it showed us that the
reflectivity of the UV channels from 1150Å to 3200Å were degraded
before flight. This amounted to an order of magnitude drop in
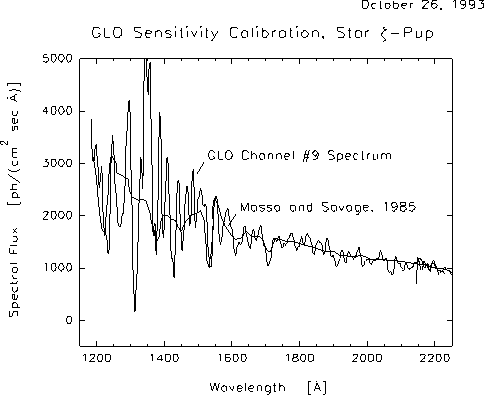
sensitivity at 1200Å. Figure 4shows the calibrated star spectrum at
the short wavelength and compared with the stellar spectrum degraded to
the GLO resolution. The sensitivity through the noisy area had dropped
to near zero, as seen in the actual recorded signal, Figure 2. The noise
is amplified by a large factor, but does show interesting correlations.
In the future these reflecting surfaces will be kept in a dry nitrogen
atmosphere until launch to prevent degradation.
![]()
![]() Last Updated: 11 March, 1996
Last Updated: 11 March, 1996
This page is maintained by:
 FIGURE 1.
 FIGURE 2.
 FIGURE 3.
 FIGURE 4.